Another year, another batch of bold predictions that are always based on recent past performance. The most common one this year is “Why not just own 100% US stocks? Why bother with international stocks? Why even bother with bonds?” Humility may not get you a lot of social media followers, but it’s a better long-term bet at making and keeping you wealthy.
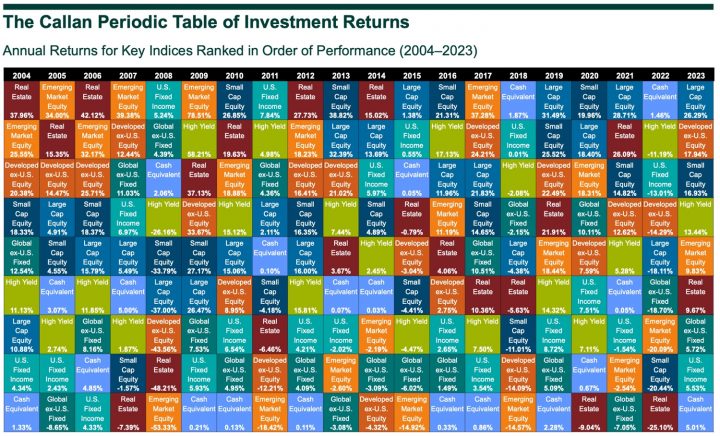
Callan Associates updates a “periodic table” annually with the relative performance of 8 major asset classes over the last 20 years. You can find the most recent one at their website Callan.com. The best performing asset class is listed at the top, and it sorts downward until you have the worst performing asset. Above is the most recent snapshot of 2004-2023 (click to enlarge). I find it easiest to focus on a specific Asset Class (Color) and then visually noting how its relative performance bounces around.
The Callan Periodic Table of Investment Returns conveys the strong case for diversification across asset classes (stocks vs. bonds), capitalizations (large vs. small), and equity markets (U.S. vs. global ex-U.S.). The Table highlights the uncertainty inherent in all capital markets. Rankings change every year. Also noteworthy is the difference between absolute and relative performance, as returns for the top-performing asset class span a wide range over the past 20 years.
The best you can do is to identify assets that are a good long-term investment, with the acceptance that the short-term ride will be unpredictable and it won’t be at the top every single year. On the other hand, many of the recent losers will eventually come back. Look at the orange squares – Emerging Markets had some crazy-awesome years in the past, and everyone wanted to own them. These days, you rarely hear anything.